“Go back to where you started, or as far back as you can, examine all of it, travel your road again and tell the truth about it. Sing or shout or testify or keep it to yourself: but know whence you came.” -James Baldwin
Whenever an action is taken within Microsoft 365, that action gets logged. Precisely what gets logged depends on the type of action that’s taken and what that action is performed on. However, every action will have a few properties in common such as the date and time it is performed, the type of action, the performing user, and the object that was affected.
Supplemental information is also logged depending on the type of action being performed. For example, an action performed on a SharePoint file will also contain information about the SharePoint site, the file name, and so on.
This can quickly add up to a significant amount of data to wade through. Not only is this pool of data quite wide, covering all the workloads in Microsoft 365 and a few from elsewhere, but it can be deep as well. Clearly, wading through this amount of data is not for everyone, and as such, Microsoft has provided several mechanisms for accessing it.
Below are the ways that usage log data is surfaced in Microsoft 365. It should be noted that the terms “audit,” “usage,” and “activity” will be used interchangeably below, as they are all used within Microsoft to refer to the same thing, the usage logs.
In Context
If you have ever checked the detail pane of a document in Microsoft 365, you may have noticed the Activity section.
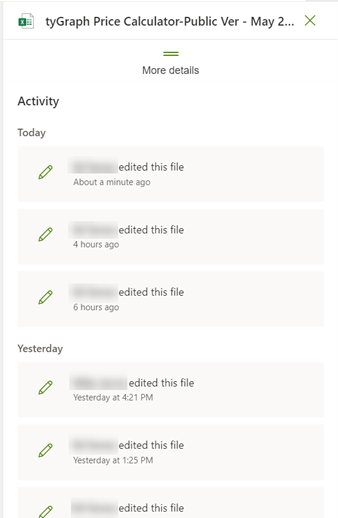
This is a view of the data in the usage logs, scoped to the selected document. By default, all activities pertaining to the selected document within the previous 90 days can be seen.
In-context reports can also take different forms. Selecting the Analytics button on a SharePoint page will open a panel showing a report detailing page view activity for that specific page.
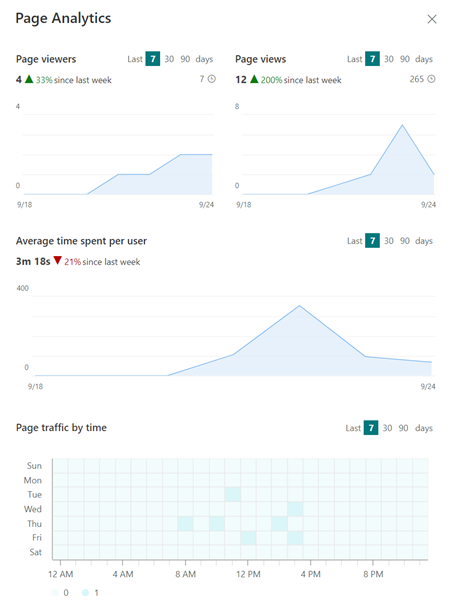
This report displays views of three metrics (page views, page viewers, time spent per viewer) across two dimensions (date and hour) and aggregated into three date-based groups (the last 7, 30, and 90 days.
In-context reports have very specific scopes. In the examples above, these are to a specific document and a specific page. They are also limited to specific, pre-defined measures. These reports are all driven by the data contained in the audit logs, but it’s not possible to drill down on them or to drill up across multiple entities. To see that information, it’s necessary to look elsewhere.
Admin Portal
The Microsoft 365 Admin portal contains a report section that has subsections for Productivity Score and Usage.
The Productivity Score displays measures that are aggregated from across your tenant. Included in these visuals are average values from organizations “similar to yours” for comparison purposes. These measures are shown over time for the previous six months and are updated once per week.
The Usage section contains a wide variety of measures from the various workloads available in Microsoft 365. Data from Exchange, SharePoint, OneDrive, Teams, and Yammer can be found here, along with non-workspace measures like active users and browser usage. Most of these visuals allow you to drill down into greater detail. For example, the Microsoft Teams detail page can be seen below:
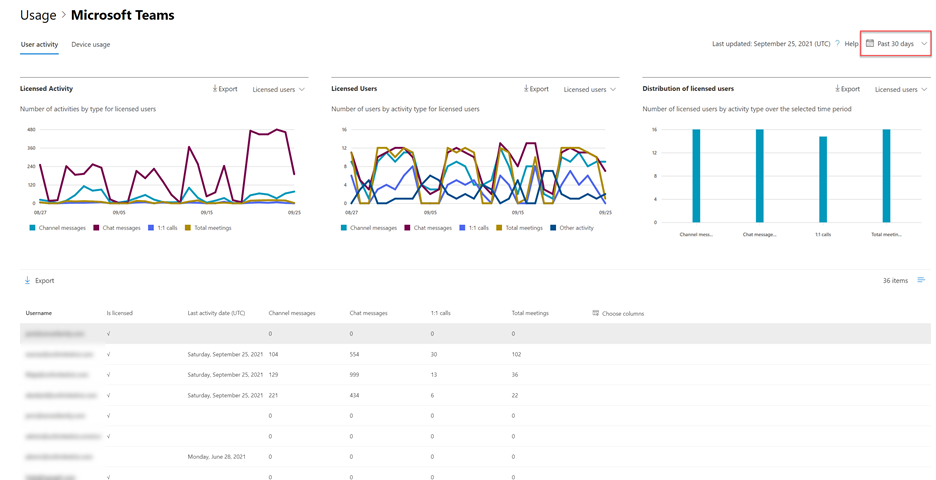
A user can select one of four possible time periods: 7 days, 30 days, 90 days, and 180 days. On this report page, you can see that the 30-day period has been selected and all the data displayed reflect that selection. The detail section displays the aggregate totals for the selected time period, which in this case are the total number of channel messages, chat messages, 1:1 calls, and meetings for each user.
It’s possible to manually export the data behind any of these visuals by selecting the export button in the desired visual. This will download a CSV with the data aggregated to the selected time period. No further detail is available.
Data in the administration portal is daily, every two days, or weekly, depending on the workload.
Microsoft 365 Usage Analytics Application
If your organization uses Power BI, the Microsoft 365 Usage Application can be an alternative to the reports available via the portal. This is a Power BI template app, and as such requires a Power license; either Pro for users or Premium for the organization.
With this application, pre-aggregated usage data (the same source as the Admin portal) is brought into a Power BI dataset, and users can access the data through a Power BI report consisting of several tables. The data here is workload-based, as it is in the Admin portal, and is pre-aggregated at the month level.
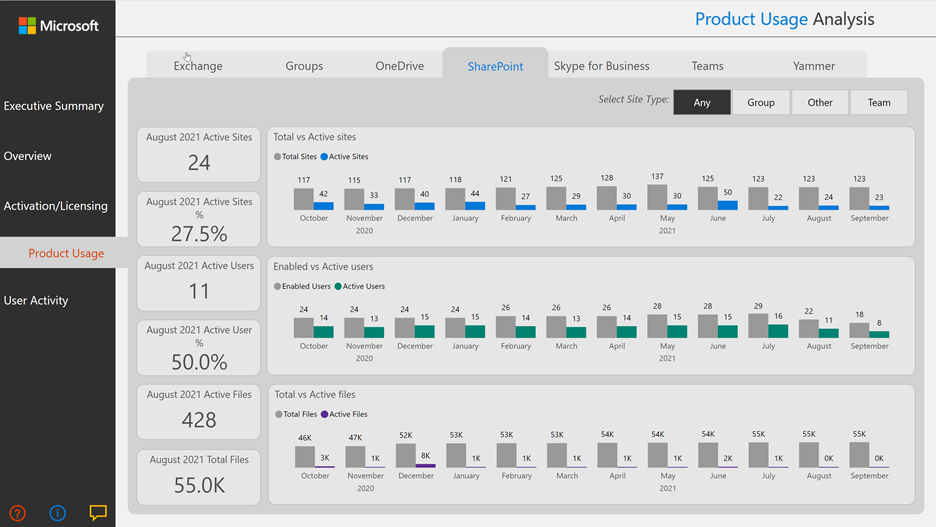
The lowest level of granularity available in the Usage Analytics Application is by month. It provides all the same dimensions and measures as the administration application.
Microsoft Graph Reporting API
The same pre-aggregated data that’s available in the Admin Portal and to the Usage Analytics Application is also available programmatically via the Microsoft Graph Reports API. Through this API it’s possible to get data down to the day level of granularity, provided that the dates are in the past 30 days. Other levels of granularity are the same as in the Admin Portal – 7, 30, 90, and 180 days. Data beyond 180 days is unavailable.
Microsoft 365 Compliance Center
All the preceding methods for working with usage data deal with data that has been pre-aggregated for specific time periods, dimensions, and measures. However, in some cases, it may be necessary to access the raw data to answer questions that have not been anticipated by the built-in reports or for detailed analysis. The Compliance Center provides this level of detail, giving direct access to audit log data.
Audit logging is enabled by default, but it can be turned off. To verify the status of logging for a tenant, follow the guidance in Turn auditing on or off – Microsoft 365 Compliance.
From the Microsoft 365 Admin Portal, selecting “Compliance” will open the Compliance Center, and the Audit Logs can be accessed by selecting “Audit” in the Solutions section. This opens a query window, allowing you to search the audit log.
Search parameters include the starting and ending date and time, activities to include, users that performed the action, and the URL of the objects to scope the query to. The following example searches for one day’s worth of activities of the copy, accessed, and downloaded type. The entire tenant is included in the search scope.

Selecting the search button returns all audit records that satisfy the query parameters.

Detailed information about each record can be seen by clicking on the item. The amount of data in the detailed window will vary based on the activity type, and selecting the Export button will download a CSV file containing detailed results. For more details on searching the audit log with the Compliance Center, click here.
By default, data can be retrieved for the past 90 days. With the appropriate license, it can be retained for up to 10 years for some activity types. For detailed information on setting up retention policies, see Manage audit log retention policies – Microsoft 365 Compliance.
Use PowerShell to Download Audit Log Data
Constructing a query through the Compliance Center is useful for ad-hoc queries, but if automation is required, PowerShell can be used to query the audit logs using the Search-UnifiedAuditLog cmdlet in the ExchangePowerShell module (see Search-UnifiedAuditLog (ExchangePowerShell) ).
PowerShell is subject to the same retention as the Compliance Center. By default, 90 days of data is available.
Office 365 Management APIs
Finally, for complete control, the audit logs can be queried via the Office 365 Management APIs (no, they haven’t yet been renamed to Microsoft 365 for some reason).
Using the Office 365 APIs allows you to programmatically query all record types for all records with no throttling and include them in a custom application.

All the same record types are available to the APIs as can be found in the Compliance Center. It’s worth noting here that despite the “Office 365” name, activity records are available for products that are technically outside of Office 365, including the Power Platform and Active Directory activities.
The data available to the APIs have one important difference to that available in the Compliance Center and PowerShell. When querying the audit log through the APIs, no more than the most recent 6 days of data will be returned, regardless of the organization’s retention policies.
Do It the Avepoint Way
Though these Compliance Centers provide thorough reports for usage and activity monitoring, it would be cumbersome to jump from one page to another. Admins need to check each report and log to see if there are any feasible risks. With AvePoint’s Policies & Insights, admins can easily find possible risks with central reporting on Microsoft 365 data, thus reducing IT’s security burden. Policies & Insights aggregates sensitivity and activity data across your tenant so your critical issues are prioritized for action. You can then edit in bulk and set policies to be enforced automatically.
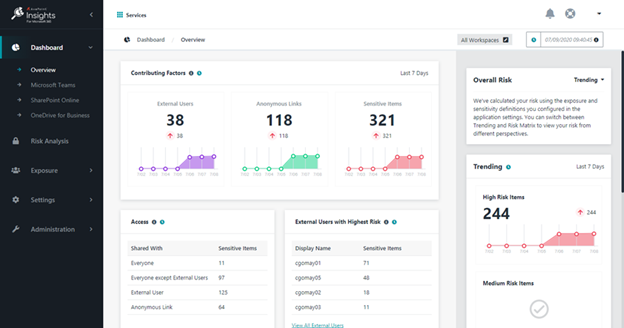
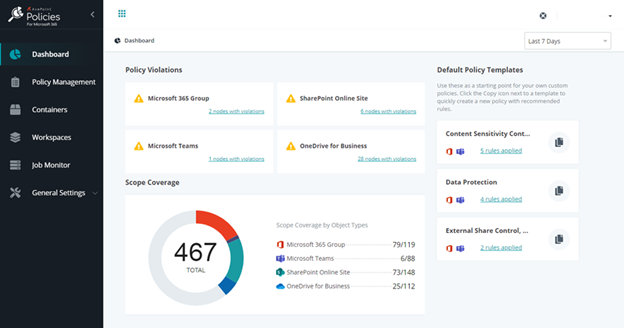
With Policies & Insights, you can drive IT efficiency by having a centralized and easy-to-use reporting dashboard. Learn more here!
Closing Thoughts
There are myriad options for accessing Microsoft 365 audit data. These options vary from simple in-context information to complex solutions applicable to developers. In the end, if you know how to make the most of the tools available to you, you should be able to find the information you need. And should there be any blind spots in the out-of-the-box solutions, there are third-party products such as tyGraph that can help you unlock the power of the data found within your usage logs!

