End User SharePoint Reporting in DocAve 6 Service Pack 5


Microsoft SharePoint provides a collaborative space for people across the organization, but to ensure its efficacy, it is important to have an understanding of what is happening throughout the environment on every level. That’s not just true for IT administrators, but for end users as well. Organizations can benefit greatly from providing users access to SharePoint reporting and analytics that is relevant to them. For example:
- Who accessed their sites?
- Where did they go?
- What did they do?
- When did they do it?
This can be extremely helpful data for users across many roles. By providing the ability to obtain this information, organizations give their workforce additional knowledge and data to make better decisions on SharePoint usage. In order to provide organizations with the tools to do this, DocAve Report Center previously introduced Social Reporting Web Parts. This gave users a window into valuable information that identified key contributors of important content and what topics are the most buzzed about within the workplace.
To continue an enriched user experience across a greater audience, DocAve Report Center in DocAve 6 Service Pack (SP) 5 now includes a new End-User Reporting Web Part. Deployment of the web part gives users visibility of what’s happening in their immediate SharePoint community via an easy-to-use interface. Each time they access SharePoint, the up-to-date information pertinent to their daily work lives will be present and available for review. The new options to be added onto the dashboard are explained below:
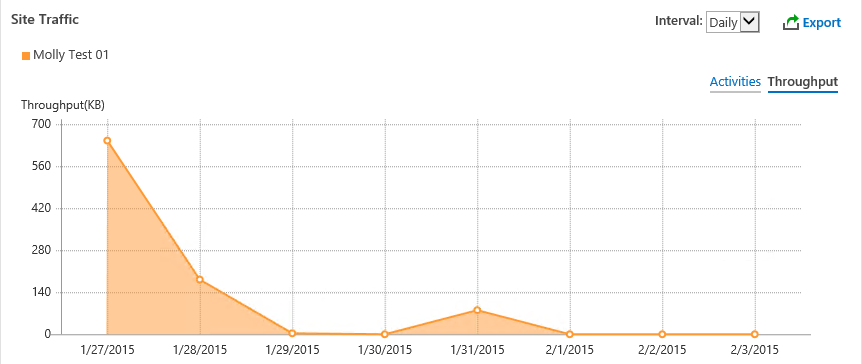
Site Traffic: Shows the traffic tracked across all of the sites that the business user administers in one graph. If site traffic is trending down, the site administrator can institute an awareness program to gain more traction for his or her site.
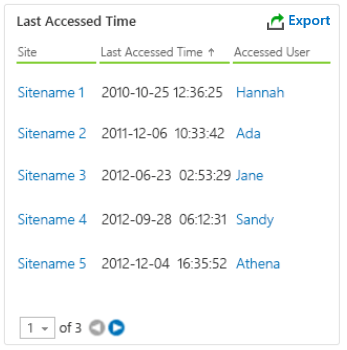
Last Accessed Time: Displays when the selected site collections or sites were last accessed, and by whom. Similar to the Site Traffic graph above, the business user can see which sites are the most popular and which sites may be deleted due to lack of recent access.
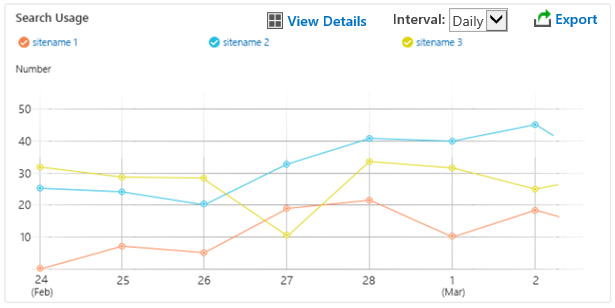
Search Usage: Displays usage data for search terms and scopes within the selected SharePoint farm. The business user can see what terms are trending across the sites he or she oversees. Then, the sites can be tweaked to have those terms incorporated so that the sites are more searchable for other users.
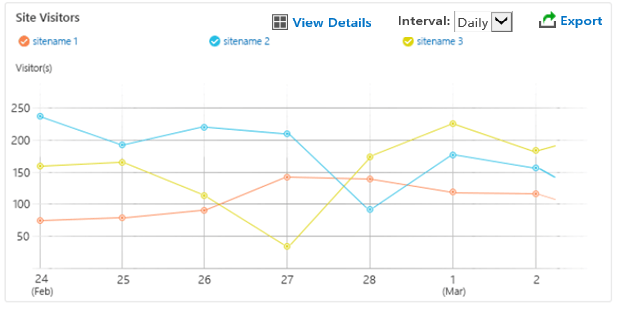
Site Visitors: Displays a count of unique visitors for the selected site collections or sites. By exposing this data to the business user, he or she can create incentives for the top visitors to further promote visitation.
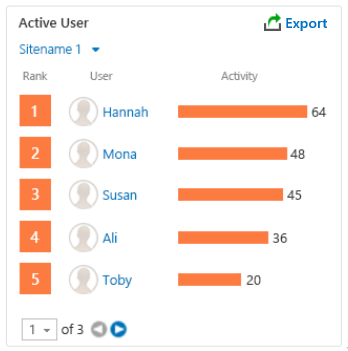
Active Users: Displays the number of non-system activities for all users within the selected site collections or sites. Again, similar to top site visitors, highly active users can be recognized as site champions and be incentivized to promote usage.
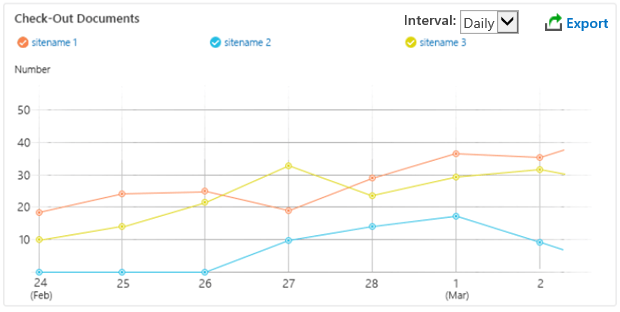
Checked-Out Documents: Displays information about checked-out documents within the selected site collections or sites. With this information, the business user can do more analysis on why these documents are being checked out and assess why certain sites have more checked out documents than others.
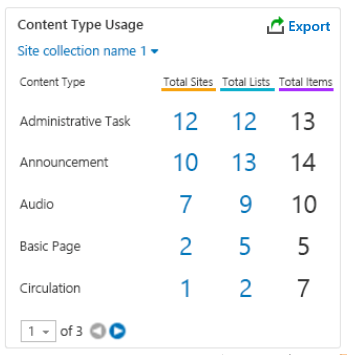
Content Type Usage: Shows the types of content used within the selected site collections or sites. The business user and SharePoint administrator can understand how storage is being allocated and what types of content takes up the most storage, allowing them to make important decisions on cost-saving opportunities.
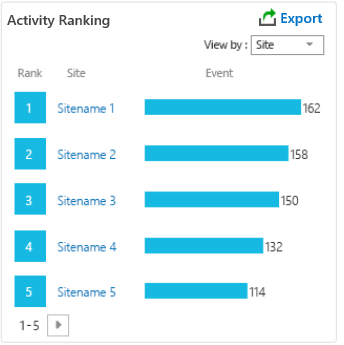
Activity Ranking: Displays the most frequent activities captured in sites, pages, documents, or lists across the chosen scope.
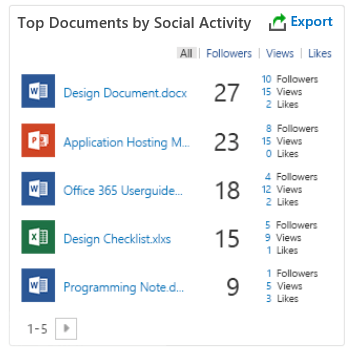
Top Documents by Social Activity: Shows the top documents on the selected site collection or sites based on social activity such as likes, views, and followers.
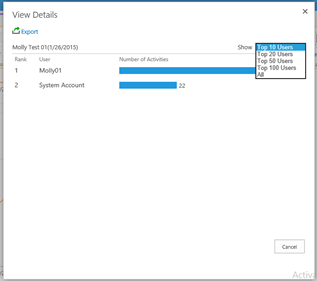
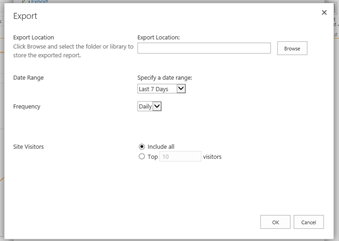
Additionally, the ability to drill down and export the reports provides greater depth on the underlying data points, which can be seen below. Data can be exported and analyzed further to capture trends and to identify how SharePoint is being used across the sites and site collections of interest.
With DocAve 6 SP 5, DocAve Report Center continues to expand usability and visibility for SharePoint users at all levels, paving the way to a more transparent workplace. To learn more about DocAve Report Center, please visit our product page, request a demo, or download a free trial today.
Have a specific question about this new feature? Leave a comment on this blog post or join us in our product discussion forums.